
2023 Mid-Year Global Market Outlook
2021 was a year of transition in global economics and market leadership. For the first time since the pandemic began the phrase ‘price stability goals’ was added to the Federal Reserve notes in January, 20211. That one statement changed market leadership as investors moved away from momentum stocks and towards low valuation stocks.
The change was drastic with US Small Value stocks outperforming (24.3%)34 US Large Growth stocks (0.9%)34 in the first quarter of 2021. This was a 180 degree change from 2020 (US Large Growth 38.3% vs US Small Value 2.6%)34. While we do expect more of this trend heading into 2022, we feel Mid and Large Value allocations offer greater risk/rewards characteristics than Small Value stocks.
Global manufacturing, CEO confidence, and Consumer Confidence were all soaring near post-pandemic highs. The remainder of 2021 was headlined with COVID-19 variants, the onset of inflation concerns, strong corporate earnings, and supply chain disruptions.
We saw these changes and changed portfolio strategy. We analyze three components when allocating our models: (1) Growth, (2) Monetary Policy, and (3) Valuations. Since the pandemic began, Monetary Policy has been most important factor in our economic model. Now the Federal Reserve is planning to change policy to combat inflation. That one change alone, replaced Monetary Policy with Valuations, as the greatest economic importance in our models.
A policy of higher interest rates affects both stock positioning and bond positioning. This means big portfolio shifts. This reallocation continued through 2021 and into 2022.
We are positive on the United States economy. The US consumer has record level wealth and wages are at an all time high. Yes, there is inflation and commodities will be benefactors. We do believe inflation will slowly ease throughout 2022. Interest rates will increase, and sectors that benefit from rising rates are set to outperform.
Patience will be key to positive performance in 2022.
Our approach is to invest in companies with predictable cash flows, earnings, and sales. We expect significant divergence in asset classes (growth vs value) and within different sectors. We believe firms with fixed costs will fare better than those with variable costs of goods sold.
Scott Tremlett, CFP®, ChFC® | Managing Partner
What we know heading into 2022:
‘There will be increased volatility in 2022’
‘There will be less diversification between stocks and bonds’
‘Movements in interest rates will provide cues to stock market leadership’
Allocation decisions to protect downside risk may hold more importance than trying to capture upside. There is once again a place for cash in portfolio strategy. We make certain portfolios have flexibility to add to our high-conviction ideas, as market volatility presents opportunities.
| Crude Oil (USO) | +64.68% |
| S&P 500 (SPX) | +26.89% |
| Nasdaq Composite (NASDAQ) | +21.39% |
| Dow Jones (DJI) | +18.73% |
| Russell 2000 (IWM) | +14.54% |
| US Treasuries (GOVT) | -1.11% |
| Emerging Markets (EEM) | -3.62% |
*Morningstar.com; accessed 1/05/2022
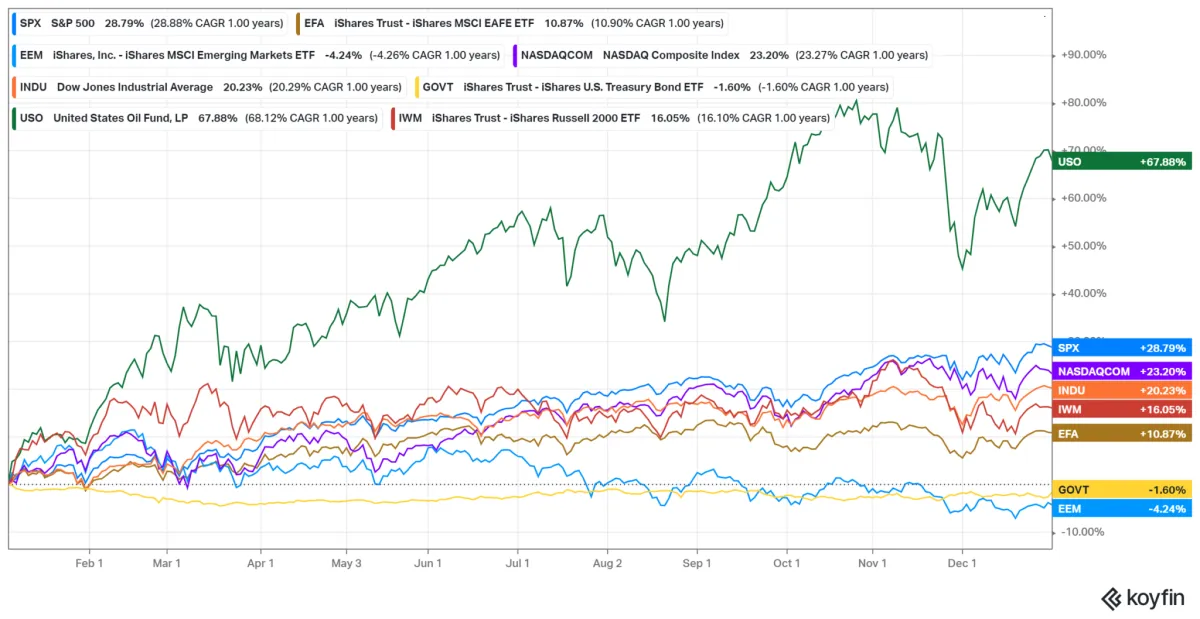
1 year chart (2021) – Nasdaq, Dow Jones Industrial Average (INDU), Russell 2000 (IWM), S&P 500 (SPX), Emerging Markets (EEM), US Treasuries (GOVT), Crude Oil (USO); Koyfin.com; accessed 1/21/2022
Patience Will Be Necessary:
A look at leading indicators:
| Indicator | Summary | ↑ ↓ |
|---|---|---|
| J.P. Morgan Global Manufacturing PMI™ Index | Manufacturing PMI at 15-month low | Negative ↓ |
| IHS Global Sector PMI™ | Signals higher output in 17 out of 21 sectors | Positive ↑ |
| J.P. Morgan Global Composite PMI™ | Global economic growth eases to 1.5 year low | Negative ↓ |
| International Monetary Fund (IMF) | Projecting 4.4% global GDP growth in 2022 | Positive ↑ |
| US: Leading Economic Indicators® | Project robust 3.5% year-over-year growth | Positive ↑ |
| US: Manufacturing PMI™ | Lowest level since October 2020 | Negative ↓ |
| US: IHS Markit US Sector PMI™ | 5 of 7 sectors increasing business activity | Positive ↑ |
| Canada: Manufacturing PMI™ | Output, new orders, purchases, employment, and sentiment all improved | Positive ↑ |
| Brazil: Manufacturing PMI™ | Factory orders and production contract at fastest rate in over 15 years | Negative ↓ |
| Mexico: Manufacturing PMI™ | Manufacturing downturn intensifies as pandemic escalates | Negative ↓ |
| Eurozone: Leading Economic Indicators® | Highest level since pandemic began | Negative ↓ |
| Eurozone: Composite PMI™ | Economic growth regained momentum to strongest pace since September 2021 | Positive ↑ |
| Germany: Manufacturing PMI™ | New order growth hits six-month high in February 2022 | Positive ↑ |
| Netherlands: Manufacturing PMI™ | Fastest rise in new orders since October 2021 | Positive ↑ |
| Italy: Manufacturing PMI™ | Output growth slows to 12-month low | Negative ↓ |
| UK: Manufacturing PMI™ | Production rises at fastest rate in six months | Positive ↑ |
| UK: Leading Economic Indicators® | Remains constant, in contraction overall | Negative ↓ |
| ASEAN: Manufacturing PMI™ | Solid manufacturing growth despite COVID-19 surge | Positive ↑ |
| Asia: IHS Markit Asia Sector PMI™ | 10 of 18 sectors registering higher output, lowest total since Sept 2021 | Negative ↓ |
| China: Caixin General Services PMI™ | Business activity slows to five-month low in January | Negative ↓ |
| China: Caixin General Manufacturing PMI™ | Slight improvement in business conditions | Positive ↑ |
| China: Leading Economic Indicators® | Highest on record | Positive ↑ |
| India: Leading Economic Indicators® | Near highest on record | Positive ↑ |
| India: Manufacturing PMI™ | Output and new orders expand as input price inflation softens | Positive ↑ |
| Indonesia: IHS Manufacturing PMI™ | Expansion slows amid COVID-19 resurgence | Negative ↓ |
| Australia: IHS Manufacturing PMI™ | Production returns to growth as COVID-19 disruptions ease | Positive ↑ |
| Japan: IHS Manufacturing PMI™ | Further improvement in operating conditions | Positive ↑ |
| Japan: au Jibun Bank Japan Services PMI™ | Business activity falls at sharpest pace since Aug 2021 | Negative ↓ |
| Russia: Manufacturing PMI™ | Output and new orders fall for first time in six months | Negative ↓ |
| Russia: Services PMI™ | Service business activity accelerates to 7-month high | Positive ↑ |
| South Korea: Leading Economic Indicators® | Two-thirds of indicators rising with balance of trade moving into positive | Positive ↑ |
| South Korea: IHS Manufacturing PMI™ | Output levels rise amid strong new order growth | Positive ↑ |
Paramount Global Rankings
(as of January 2022)

#1. United States
Current Power: 1 – #1 Composite PMI Current Category
Momentum: 2 – #2 GDP Momentum Category
Overall Rank: 1 – Top 5, 3 out of 4 Current & Top 5 all Momentum Categories
Earnings are growing from all-time highs. Producer prices are slowing, increasing at slowest pace since September, 2021.

#2. Netherlands
Current Power: 3 – #2 Manufacturing PMI Current Category
Momentum: 1 – #2 Manufacturing PMI Momentum Category
Overall Rank: 2 – Top 5 in every Category
Manufacturing well above long-run average. Rapid overall improvement in business conditions after short COVID-19 lockdown in December 2021.

#3. India
Current Power: 4 – #1 GDP Current Category
Momentum: 5 – #1 Manufacturing PMI Momentum Category
Overall Rank: 3 – Top 10 in every Category
8 straight months of growth in factory activity. Input costs rose the least in 6 months.

#4. Canada
Current Power: 6 – #7 in all Current ranked Categories
Momentum: 3 – #1 GDP Momentum Category
Overall Rank: 4 – Top 10 in every ranked Category
Investments in inventories by manufacturers and wholesalers should be tailwinds as net foreign demand picks up.

#5. Italy
Current Power: 2 – #1 Manufacturing PMI Current Category
Momentum: 10 – #3 Manufacturing PMI Momentum Category
Overall Rank: 5 – Top 10 in every Category
20 consecutive months of growth in factory activity. Strong demand has led to the growth in factory activity.

#6. Spain
Current Power: 8 – Consistent strength in Manufacturing
Momentum: 4 – #5 Manufacturing PMI Momentum Category
Overall Rank: 6 – Top 10 in every Category
Improving manufacturing operations for 13 months. Rate of job creation at highest level since August 2021.

#7. France
Current Power: 9 – #3 Composite PMI Current
Momentum: 9 – #4 Composite PMI Momentum Category
Overall Rank: 7 – Positive Growth in all Categories (Current, Momentum)
Demand for French services strongest since July 2021. Output growth strong in both services and goods.

#8. Australia
Current Power: 5 – #3 Leading Economic Indicators Current Category
Momentum: 16 – #18 GDP Momentum Category
Overall Rank: 8 – #4 for both Composite PMI and Manufacturing PMI Current
Momentum fading in Australia. Expected drop in overall ranking.
Wall Street Says
Inflation will peak in Q1 2022 and then moderate to 3% in Q4 202235
Four 25 basis point rake hikes expected in 2022 with more possible in 202335
Wages and household net worth both recently hit all time highs36
US household debt-to-GDP ratio down nearly 20% since 2008 peak36
The percentage of consumers considering the purchase of large household goods hit its lowest point in five decades37
Increasing margins accounted for approximately 75% of 2021 earnings growth38
Inflation is likely to peak in Q1 2022 before moderating back to 2.5-3.0% by year-end39
Forecasting US core PCE (inflation) to end 2022 at 3.7%, and for the 10-year treasury to end 2022 at 2.25%40

Market Outlook, 2022
Looking at 2022, we expect positive economic growth and elevated inflation. Inflation will begin the year in record territory. We anticipate inflation to slow, with demand reducing with higher interest rates and supply increasing as supply chain disruptions begin to reopen.
We believe the global economy is in mid-cycle and we remain positive to equity risk assets. We do also believe that this isn’t a ‘normal’ mid-cycle environment for markets. Historically, mid-cycle markets are periods where valuations are reassessed and technology, communication services, and discretionary stocks outperform. However, historically the US economy takes 3 years for earnings to revert back to pre-recession levels. In 2021, (after the initial shock of COVID-19) revenues returned to pre-recession levels in 11 months. This theme presents challenges to certain sectors and individual companies where valuations continued to stretch throughout 2021 with the extreme ‘snap back’ in the US economy. This valuation reassessment created sharp drops to high valuation growth stocks in the fourth quarter of 2021.
Along with the change in valuations we have record level inflation. Inflation means increases in the Federal Funds rate. When interest rates rise, valuations compress (see below: How Do Rising Interest Rates Affect Stocks?). Mid-cycle markets are normally the longest period in the economic cycle, and market trends will change. Today, we believe there is a place for select technology firms to thrive. Yet, we are not believers in communication services and discretionary stocks outside of a few particular names. With interest rates increasing we favor financials; more specifically, broker/dealers and regional banks. Our research illustrates these two sub-sectors as the largest benefactors to rising rates. We feel that supply chain disruptions and slowing demand will have a greater impact on discretionary stocks than defensive areas like healthcare and consumer staples. Typically, consumer staples outperform in recessionary periods. We are not predicting a recession. We are taking into consideration the differences in economic cycle this time around. With the speed of the economic recovery and the rapid rise in inflation, we believe markets will exhibit certain mid-cycle trends as well as late-cycle movements.
Another trend for 2022 is limited diversification between stocks and bonds. Rising rates do have a negative effect on both asset classes. From 2015-2018, the S&P 500 dropped an average of -0.4%41 the day the Federal Reserve increases rates and -0.9%41 the in the next month. In 2018, the Fed moves were coupled with pronounced volatility. Four rate hikes were followed by: +3.8%, -5.4%, -8.5%, and +6.6%41 monthly returns. As for bonds, the volatility depends on the duration of the bond. Duration is a measure of sensitivity of the price of a bond to a change in interest rates. For example, the US Aggregate Bond Index (as measured by AGG ETF) has an effective duration of 6.6442. That means the price of the portfolio will move conversely to a +/-1% shift in rates by +/-6.64%. While this isn’t a perfect science, and there are bonds that have variable interest rates to offset increases in interest rates (floating rate bond/note), we have decided that cash is a better investment than core bonds. Cash may not pay high interest but the price is not impacted by increases in interest rates (0% is preferred over -4%).
The dynamics are there for increased volatility. During periods of volatility we focus on the downside capture of our portfolio. Downside capture is a statistical measure of overall performance in down markets. We prefer investments that may limit downside movements. Our strategy going into 2022 is to win by losing less during periods of market contraction. We do believe by year-end markets will turn positive.
2022 Investment Themes:
(1) We prefer US equities to overseas equities
(2) We see headwinds to both Emerging Markets and International Developed Markets
(3) We will see high inflation in 2022 – we expect inflation to slow throughout the year
(4) We think that treasury yields will increase
(5) We believe that lower valuation stocks will outperform
(6) We believe the best returns are made when consumer confidence is negative
(1) US > OVERSEAS
The US is showing relative strength in every category. US earnings are expected to increase marginally. Corporate America has increased margins in 2021 to help offset increases in costs of goods sold. We see financials benefiting from increasing interest rates due to Federal Reserve expectations.
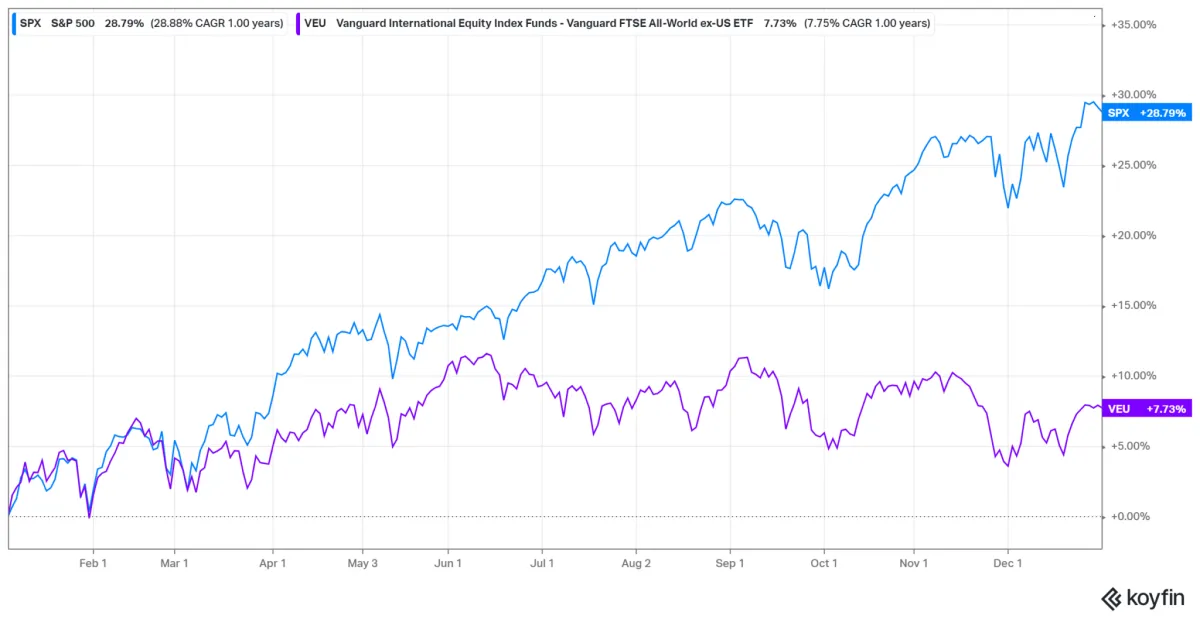
1 year chart – S&P 500 (SPX) vs Vanguard All-World ex-US (VEU), Koyfin.com; accessed 1/21/2022
(2) UNDERWEIGHT EMERGING MARKETS & INTERNATIONAL DEVELOPED MARKETS
There are bright spots in India, Netherlands, Canada, and Spain. Momentum is negative in Australia, Brazil, Germany, Japan and the United Kingdom. European economics in significant downward trend. There has already been significant movement in rankings between January to February; for example Australia down 10 spots, from 8 to 18 in one month.
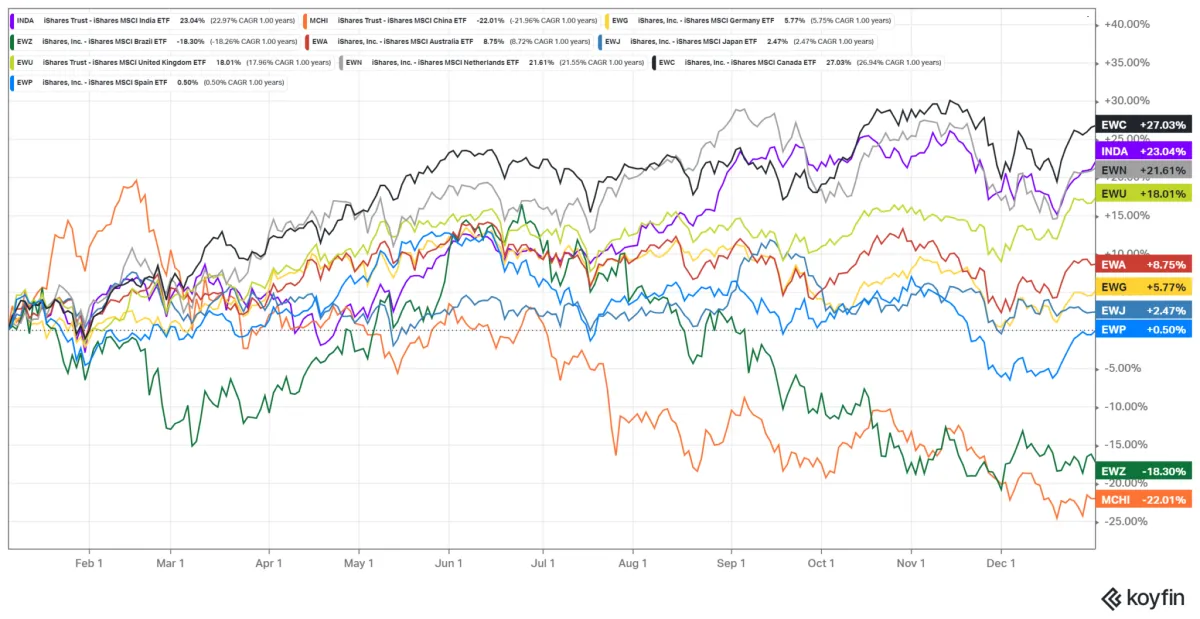
1 year chart – India (INDA), China (MCHI), Germany (EWG), Brazil (EWZ), Australia (EWA), Japan (EWJ), United Kingdom (EWU), Netherlands (EWN), Canada (EWC), Spain (EWP), Koyfin.com; accessed 1/21/2022
(3) HIGH INFLATION
Inflation will remain high until easing later in 2022. Policy changes from the Federal Reserve to slow growth and the easing of supply chain disruptions will gradually reduce inflation. Recent used car sales statistics do illustrate fading demand due to higher prices.
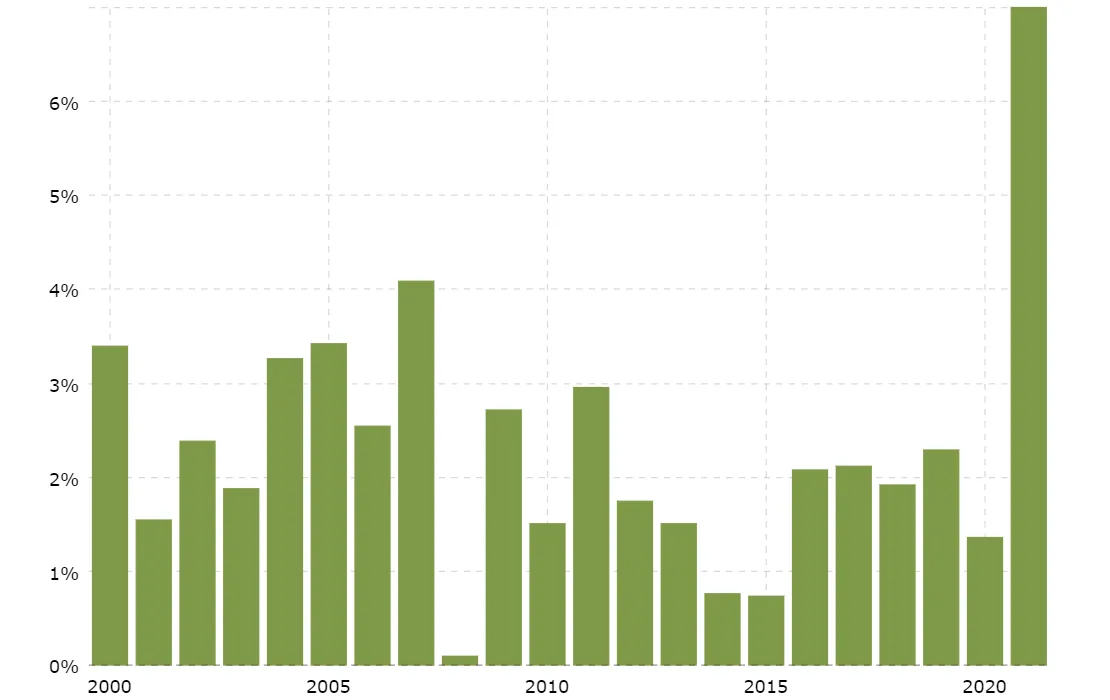
20 year chart – US Inflation rate, macrotrends.com, accessed 1/22/2022
(4) INCREASE IN YIELDS
Stronger growth and inflation typically increase bond yields. Fiscal policy is expected to increase money supply.
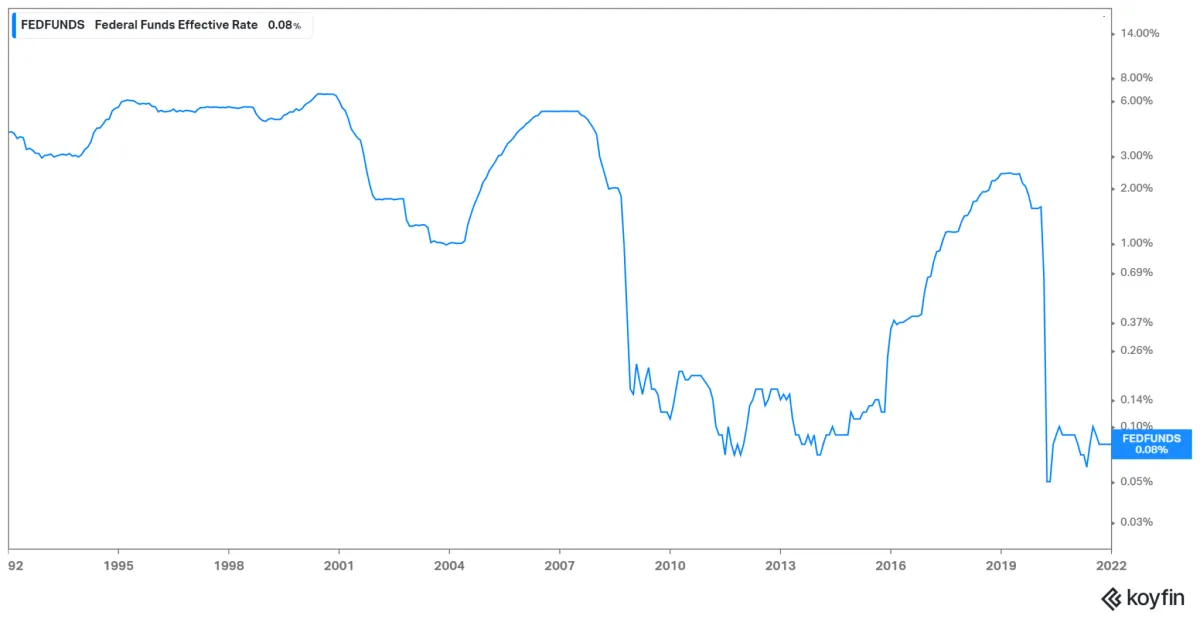
30 year chart – US Fed Funds Rate, Koyfin.com; accessed 1/21/2022
(5) SIGNIFICANT PREFERENCE TO LOW VALUATIONS
With the change in Federal Reserve policy first highlighted in Q1 2021, we see the divergence between low valuation and high valuation stocks. We believe technology still holds a place in a portfolio, however we see significant headwinds for companies with unstable earnings and variable costs of goods sold.
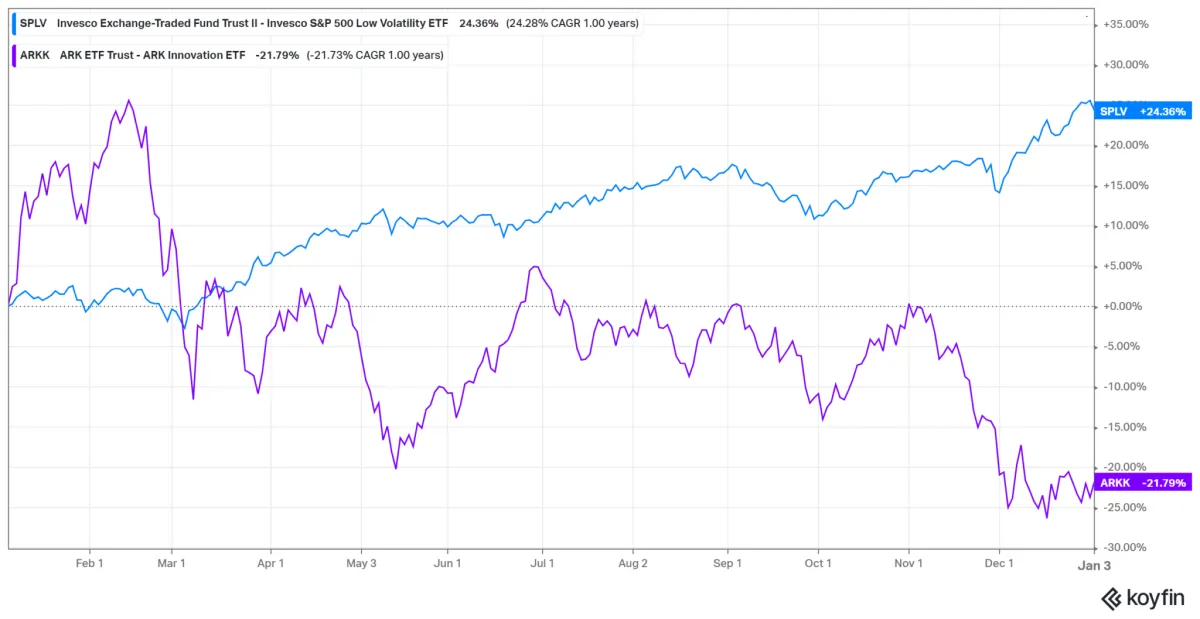
1 year chart – Invesco S&P 500 Low Volatility (SPLV), Ark Innovations (ARKK), Koyfin.com; accessed 1/21/2022
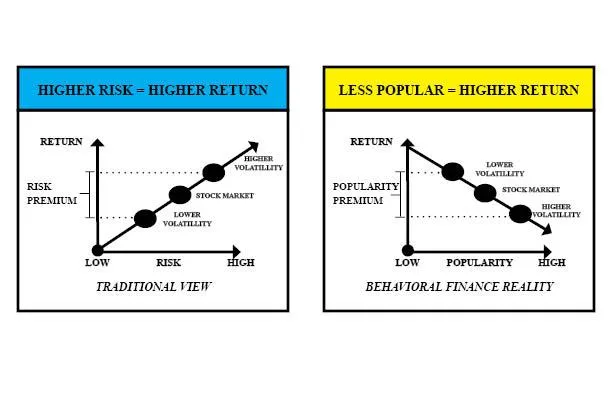
(6) CONSUMER CONFIDENCE AND MARKET RETURNS
What US equity factor is the most predictive of future market returns? Most investors will answer ‘Fundamentals’ or ‘Momentum’ – however studies by Roger Ibbotson (Professor in Practice Emeritus, Yale School of Management) illustrate that the biggest contributor or detractor is actually Popularity. Traditionally market participants expect the greater the risk = greater return. Studies have shown that returns are not necessarily risk based. In reality the less popular the characteristics of a stock/asset class may be = the greater the return. From the period 1980 – 2016 the highest popularity stocks averaged 7.67%43 and the stocks with the least popular characteristics averaged 15.30%43.
Investor Education
HOW DO RISING INTEREST RATES AFFECT BONDS?
Bonds and interest rates have an inverse relationship. If interest rates rise, investors will prefer higher paying bonds. Investors then sell the lower paying bonds, driving down those bonds prices.
HOW DOES THE FEDERAL RESERVE AFFECT THE BOND MARKET?
The Federal Reserve controls the federal funds rate. The federal funds rate is the target rate at which commercial banks borrow and lend their excess reserves to each other overnight. This influences short-term rates on consumer loans, credit cards, and new bond issues. If new bond issues must keep up with the federal funds rate to create demand, lower paying bonds are sold pushing down those bond prices.
HOW DOES THE FEDERAL FUNDS RATE AFFECT INFLATION?
In general, when interest rates are high, the economy slows and inflation decreases. But why? If rates are high, consumers have less money to spend. Investors tend to save more because savings returns are higher. Additionally, loan demand decreases as borrowing costs increase.
SHOULD I ASSUME THAT THE 10-YEAR TREASURY WILL INCREASE ALONG WITH THE FEDERAL FUNDS RATE?
Normally the 10-year treasury yield is a precursor to expected increases in the federal funds rate. It will move ahead of the Federal Reserve and set market expectations. Historically rates have actually decreased after fed funds rate escalation. For two reasons: (1) Bond markets have a tendency to overprice actual Federal Reserve policy changes, (2) Investors expect economic growth to slow with higher rates and move to safer assets.
HOW DO RISING INTEREST RATES AFFECT STOCKS?
Generally speaking, rising interest rates are not welcomed by stock investors.
By raising interest rates, the Fed is increasing borrowing costs
Rising interest rates would encourage people to save more with higher savings yields
Credit card and other variable debt payments become more expensive slowing demand due to less consumer liquidity
Decreasing money supply in the system means a slower economy and less inflation
Dividends and Earnings are discounted to the new increased interest rates
Usually Federal Reserve interest rate hikes take 12 months for widespread economic impact
ARE ALL EQUITY SECTORS AFFECTED EQUALLY?
No, some sectors actually benefit such as financials. In contrast, high valuation firms (or firms without positive earnings) feel the greatest negative impacts.
DO RISING RATES AFFECT CORPORATE EARNINGS?
Yes, if consumers have less disposable income to spend sales and profits may be hindered.
WHAT DOES WARREN BUFFET THINK?
Warren Buffett said in 1994 at Berkshire’s annual meeting: “The value of every business, the value of a farm, the value of an apartment, the value of any economic asset is 100% sensitive to interest rates. The higher interest rates are, the less that present value is going to be.”15
Asset Allocation Review
| US Equity: | Positive |
| Developed Int’l Equity: | Neutral to Negative |
| Emerging Markets Equity: | Negative to Neutral |
| US Government Bond: | Sell |
| US Corporate Bond: | Sell |
| International Bond: | Sell |
| Emerging Markets Bond: | Sell |
| REIT/Commodity: | Positive |
| Preferred Sectors: | Financial Services, Technology |
Allocation Update
In November 2020 we discussed reducing Large Cap equities and increasing Small Cap equities.
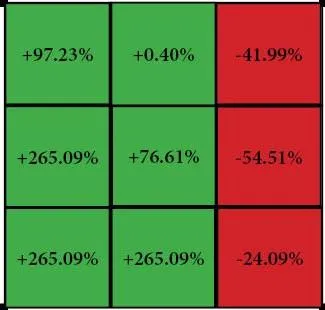
Here’s how the overall allocation has changed since November 2020 using a Morningstar Style Box.
Sector Exposure
FINANCIAL SERVICES
TECHNOLOGY
ENERGY
HEALTHCARE
CONSUMER DEFENSIVE
Equity Exposure
Morgan Stanley
Apple Inc
AbbVie Inc
NVIDIA Corp
Schlumberger Ltd
LPL Financial Holdings Inc
Assurant Inc
Bill.com Holdings Inc
Pioneer Natural Resources
Broadcom Inc
Fair Isaac Corp
Coca-Cola Co
Microsoft Corp
Charles Schwab Corp
Alphabet Inc
Group 1 Automotive Inc
Hunstman Corp
Livent Corp
Danaher Corp
Qualcomm Inc