
2023 Mid-Year Global Market Outlook
Better than feared. Markets have been lifted by this general theme – ‘Better than feared’. Throughout 2022 many corporations spent the year lowering estimates for sales, growth, and earnings. Markets expected a recession this year and had even priced in a Federal Reserve that would be cutting interest rates by year end. We did not expect a recession and we do not see a recession on the short-term horizon. One of the key attributes to a recession is high unemployment, however there are still almost 2 open jobs for every unemployed person1. It seems like every quarter economists raise GDP (Gross Domestic Product) forecasts and push off this ‘upcoming recession’.
Since July of 2022, the federal funds rate has gone from 1.75% to 5.50%. The speed of this hiking cycle has been felt in various ways already. Headline CPI (inflation) has gone from 8.4% to 3.1%. It is estimated that increased interest rates on lending services have led to a reduction of the $2 trillion excess savings. Statistically that excess has been cut in half and the remaining funding is in the hands of high income earners who aren’t expected to spend.
This boiled over in the first quarter of 2023. The quarter ended with fears of a full-blown banking crisis and increased odds of a recession. Conversely, the second quarter saw resilient growth, containment of banking issues, and a rally in the S&P 500. Two very different naratives in the same year.
2023 stock market enthusiasm has been based on growing prospects for a ‘soft landing’. Stocks have shrugged off rate volatility, high rates and dollar stength. Historically stocks move inverse to the US dollar.
The strength in stocks is at odds with rising Treasury rates and potential for further rate hikes. The rally seems to be based on an expectation for a recovery in earnings in 2024. If earnings do recover, it’s possible that stocks could be headed for new highs.
Allocation decisions in 2023 need flexibility. This is a market for active management within asset classes and sector weights. Overweights to growth stocks have led gains this year. Globally, we see improving growth characteristics overseas. Growth and a weakening US dollar provide optimism for international equities. Fixed income is becoming more attractive as yields rise.
| Nasdaq Composite (NASDAQ) | +32.74% |
| S&P 500 (SPX) | +16.38% |
| MSCI EAFA (EFA) | +9.48% |
| Russell 2000 (RTY) | +8.02% |
| Dow Jones Industrial (INDU) | +3.84% |
| Emerging Markets (EEM) | +3.51% |
| Aggregate Bond (AGG) | +0.40% |
| Government Bond (GOVT) | +0.26% |
| United States Oil Fund (USO) | -6.05% |
The pivot markets have been waiting for! The federal reserve’s pivot away from combating inflation and towards stabilizing employment is underway. Why? Inflation is coming down headlined by reductions in wage growth and shelter. Indeed, the US economy continues to expand at a rate of 2%-3% per year, and robust consumption figures persist. However, a closer examination reveals that some underlying weaknesses are starting to emerge. Earnings estimates are coming down and revenue projections are lagging expectations. Furthermore, unemployment has increased, and job openings are coming down. The greatest risk, you might inquire? According to the Federal Reserve, it would be the scenario where individuals start believing that the job market is deteriorating, leading them to curtail their spending.
As for asset management, it is a time to understand the risks in different investments. Will rates continue to drop helping bond performance? Will earnings keep up with lofty estimates? Will the stock market broaden, allowing different sectors and stocks to perform? Or will large firms continue to dominate market trends? Will international stocks hold up during a period of heightened geopolitical uncertainty? Where are investors able to find non-correlation in current markets?
These are some of the questions that investors are faced with. Market analysts often vary widely in their projections, which historically underscores the challenge of predicting market trends. Indeed, every research department that announced their year-end targets for the S&P 500, which I have followed, has been incorrect this year. Currently, the S&P 500 is trading above the highest estimate that was previously reported. This has been in anticipation of the federal reserve dropping interest rates, as they did last week. How much of this is already priced in, time will tell. Interesting that the markets are not always positive 1 year after the first rate cut by the fed. Why? Well, the federal reserve doesn’t lower rates because times are great. They lower rates because they see economics slowing – in this case the labor market. Don’t forget that the excess savings built up during the pandemic, has been spent…or that the heightened savings levels in the US during the pandemic have dropped drastically…or that credit card/auto loan deficiencies have begun to increase. We are not headed for a rapid deterioration in my opinion, however valuations versus momentum will prove more important as volatility picks up.
We don’t need a deep recession for inflation to come down meaningfully. We are optimistic inflation will come down naturally.
Our approach is to ‘stay alive, and look for the ball’. That sports analogy is a perfect way to explain investment management in today’s economy. We expect significant divergence in asset classes and within different sectors. Tactically, it is important to capture momentum in asset classes that present opportunities. However, it is just as important to thoughtfully control portfolio risk.
Scott Tremlett, CFP®, ChFC® | Managing Partner
| US Equity: | Overweight |
| Developed Int’l Equity: | Overweight United Kingdom; Underweight Japan; Underweight Europe |
| Emerging Markets Equity: | Overweight India; Underweight China; Underweight Brazil |
| US Government Bond: | Underweight |
| US Corporate Bond: | Neutral |
| International Bond: | Underweight |
| Emerging Markets Bond: | Underweight |
| REIT/Commodity: | Underweight |
| Alternative Assets: | Overweight |
| Preferred Sectors: | Financial Services, Industrials, Technology |
Allocation Update13

Equity Exposure13
Delta Air Lines
Apple Inc
Synopsis Inc
NVIDIA Corp
Palo Alto Networks
Salesforce Inc
Fortinet Inc
PDD Holdings Inc ADR
Interactive Brokers
Alphabet Inc
Livent Corp
Visa Inc
Mastercard Inc
Workday Inc
Berkshire Hathaway Inc
MercadoLibre Inc
HubSpot Inc
LPL Financial Holdings Inc
Southwest Airlines
Okta Inc
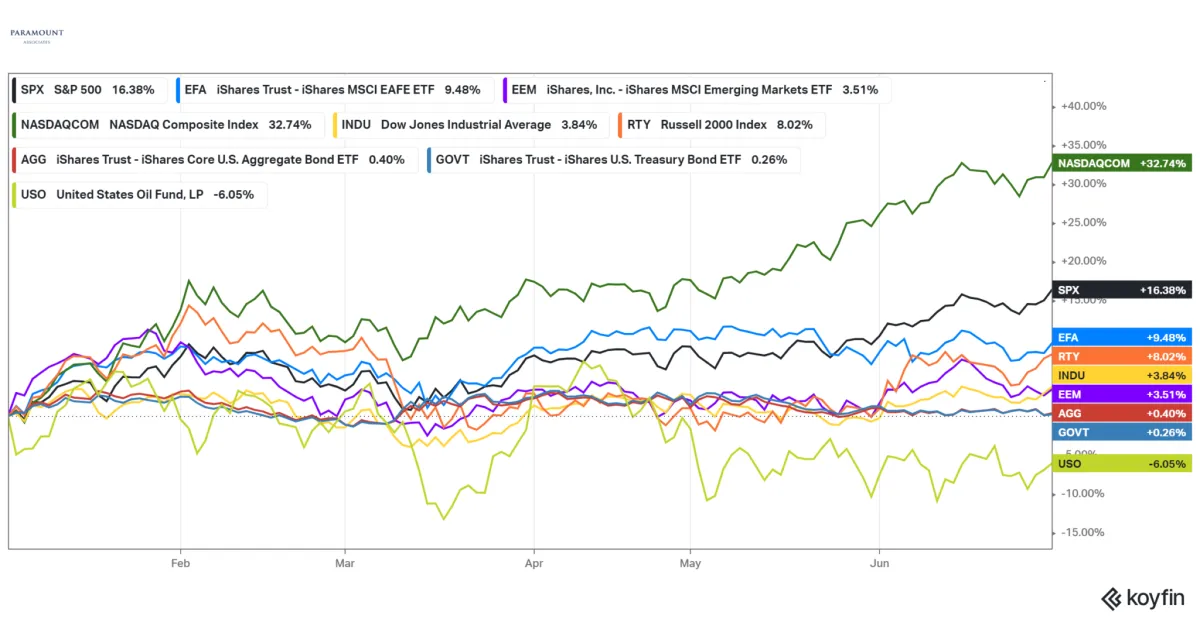
Year to Date through 6/30/2023 – Nasdaq, Dow Jones Industrial Average (INDU), Russell 2000 (RTY), S&P 500 (SPX), Emerging Markets (EEM), Aggregate Bond Index (AGG), US Treasuries (GOVT), Crude Oil (USO); Koyfin.com; accessed 7/19/2023
Paramount Global Rankings
(as of July 2023)

#1. India
Current Power: 1 – Top 3 all Current Categories
Momentum: 6 – #2 Leading Economic Indicators Momentum Category
Overall Rank: 1 – Overweight
Strongest Industrial Production since November 2022. Services output increasing at second-fastest pace in close to 13 years.

#2. Brazil
Current Power: 5 – #5 Leading Economic Indicators
Momentum: 3 – #2 Composite PMI Momentum Category
Overall Rank: 2 – Equal Weight
Anticipated tax breaks are already reflected in stronger industrial production. Positive trajectory suggests near term growth, possible deceleration in 2024.

#3. Japan
Current Power: 6 – Broad based strength in Current Power Categories
Momentum: 3 – #1 Leading Economic Indicators Momentum Category
Overall Rank: 3 – Overweight
Employment increased to second-fastest pace in the year to date. Business sentiment strengthened to the strongest since October 2021.

#4. Mexico
Current Power: 4 – Top 6 in all Current Categories
Momentum: 11 – #4 in Manufacturing PMI Momentum Category
Overall Rank: 4 – Equal Weight
5 consecutive months of expansion in factory activity. Factory output grew most in four years.

#5. China
Current Power: 2 – #1 Leading Economic Indicators & GDP Growth Current Category
Momentum: 15 – Bottom half in all Momentum Categories
Overall Rank: 5 – Underweight
Leading Indicators have declined 4 of last 6 months. Only positive contributors have been new loans, real estate construction, and machinery and transport equipment imports.

#6. United States
Current Power: 3 – Strength in all Current Categories other than Manufacturing PMI
Momentum: 15 – Bottom 25% Leading Indicators and Manufacturing PMI Momentum Categories
Overall Rank: 6 – Underweight
Leading Indicators have declined for 14 straight months. Possible upgrade? Inflation direction, corporate earnings, and future Fed policy are all determining factors.

#7. Switzerland
Current Power: 17 – Bottom 25% in all Current Categories
Momentum: 2 – #2 Manufacturing PMI Momentum Category
Overall Rank: 7 – Underweight
Businesses exercising utmost caution in purchasing and inventory management despite falling prices and better delivery conditions.

#8. France
Current Power: 12 – #4 Leading Economic Indicators Current Category
Momentum: 10 – #5 PMI Manufacturing Momentum Category
Overall Rank: 8 – Underweight
Growth remained positive in Q1 despite challenges in demand, inflation, and higher interest rates. Weakness in non-financial components remains.
#11. United States

Current Power: 6 – Bottom 3 in Manufacturing
Momentum: 16 – Ranked second from the bottom in Manufacturing
Overall Rank: 11 – Equal weight
Monetary Policy: 4.75% – 5.00%
Last change: Reduced Sept 2024
Valuation: Overvalued
A decline in manufacturing demand has led firms to reduce output. Input cost inflation has accelerated to a 16-month high. The reduction in new orders is the most significant since June 2023. For the first time in 2024, staffing levels have decreased as firms respond to falling new orders and lower output by drawing down inventories and cutting workers. Meanwhile, service activity has risen at the fastest pace in nearly 2.5 years, although employment in the services sector has also decreased. There are emerging signs that the downturn in manufacturing may spill over into the broader economy.10
Wall Street Says
2023 performance has been driven by valuation expansion and growth will slow; given this backdrop we ‘remain defensive’ and are focusing on consumer staples, utilities, and health care3
If we are in a early-cycle recovery – a period when the market is bouncing off of bear-market lows and when gains are primarily driven by expanding P/E ratios – it’s common to see P/E ratios rise by close to 50%. If that pattern holds this time around and based on 2024 projections for earnings, we would see markets well above the January 2022 high7
We are now underweight equities accross all three major regions. We have been encouraged by more durable fundamentals in the U.S. – but believe valuations are too elevated with the global economy reaching stall speed8
89% of a bond’s performance is attributable to its starting yield, and today rates are the highest in 20+ years9
We view commodities and Japanese and emerging market equities as good hedges for a peaking US dollar10
Our framework remains in a contraction regime of below-trend and decelerating growth and more defensive posture in portfolios11
We believe the earnings downgrade cycle of recent months is nearing an inflection point12

Market Outlook
I believe the global economy is strong enough to withstand higher interest rates for longer. I also believe that this isn’t a ‘normal’ environment for markets. I added some contradictory notes in Wall Street Says to make a point. Expectations for inflation, markets, fixed income, the US dollar are all over the board. You can read one report from an analyst and then another that completely contradicts the first report, all from within the same research department. This, I think is a positive – the heads aren’t all thinking the same thing. However, consumer confidence and consumer sentiment have been beating consensus estimates significantly (which I view as negative). Again, two factors contradicting themselves.
With a strong labor market, restabilizing banking sector and resiliant growth, Fed Chair Jerome Powell doesn’t think economics are restrictive enough to bring inflation back to 2% target. Earnings revisions for 2023 have fallen sharply in the U.S. The question is will the slowing economy and earnings expectations start to even out? So far in 2023, earnings have continued to beat the lower expectations. In total, S&P 500 earnings revisions are -12%5 since this time last year – with consumer discretionary and materials leading the plunge. Outside of the U.S. earnings revisions are only down -2%5, but conditions vary by region.
Looking at the second half of 2023, I expect economic growth to slow. Manufacturing PMIs globally are contracting and the US Leading Economic Indicators are in a major contraction. Inflation will come down but I expect some choppiness in that journey. I do not expect a recession in the short-term. One of the major variables to a recession is high unemployment and the labor market remains strong. With the rise in real wages, stabilization in the housing market and firm second quarter earnings apace with gradually cooling inflation the possibilities for a soft-landing has widened.
Earnings have come in better than expected, however we are beginning to see revenues fade. From my conversations it seems companies are still taking a cautious approach. Global CEO confidence plunged in May, will this be the beginning of the economic slowdown? I am not afraid of risk in this market, however a prudent approach is appropriate.
The dynamics are there for increased volatility. The dynamics are there to continue the current trajectory. Analysts are all over the place with their projections. Stay alive, and look for the ball.
2023 Investment Themes:
(1) Overweight International and underweight United States
(2) Headwinds in Europe, we are overweight India and Japan
(3) Inflation will drop throughout the remainder of 2023 and throughout 2024
(4) Treasury yields have peaked
(5) Sustainable growth will outperform, however expectations are increasing
(6) Strength in consumer confidence is cause for concern
(1) OVERSEAS > UNITED STATES
Growth is one factor to consider and there are areas around the globe that are significantly outperforming expectations. The International Monetary Fund expects China and India alone to contribute half of the world’s growth this year. The second factor is the US dollar. I believe the dollar has peaked and will create a tailwind for global market relative performance.
The Fed – Economy at a Glance – Policy Rate (federalreserve.gov); accessed 9/23/24
This was not a popular theme to begin 2024. Markets were expecting 6 quarter-point rate cuts throughout 2024. The economy exhibited strength and growth, job availability was abundant, and inflation persisted, even showing an increase through March. It’s important to note that the Federal Reserve lowers interest rates to assist the economy, particularly to encourage growth or to prevent job losses. Considering that to be the Fed’s mandate, I did not see a reason to reduce rates until some cracks began to show. Unemployment has ticked up recently with vacancies and hiring both down. Although major layoffs have not yet occurred, the rising unemployment rate itself poses a risk if consumers start thinking, ‘the job market is deteriorating, I should cut back on spending’. Below is the latest ‘dot plot’ from the Fed (participants offer guidance on the direction, this is not an official projection nor actual policy) and you can see the disparity amongst the voting members. Future inflation numbers and employment factors will be considered, and actual policy moves will be data dependent.
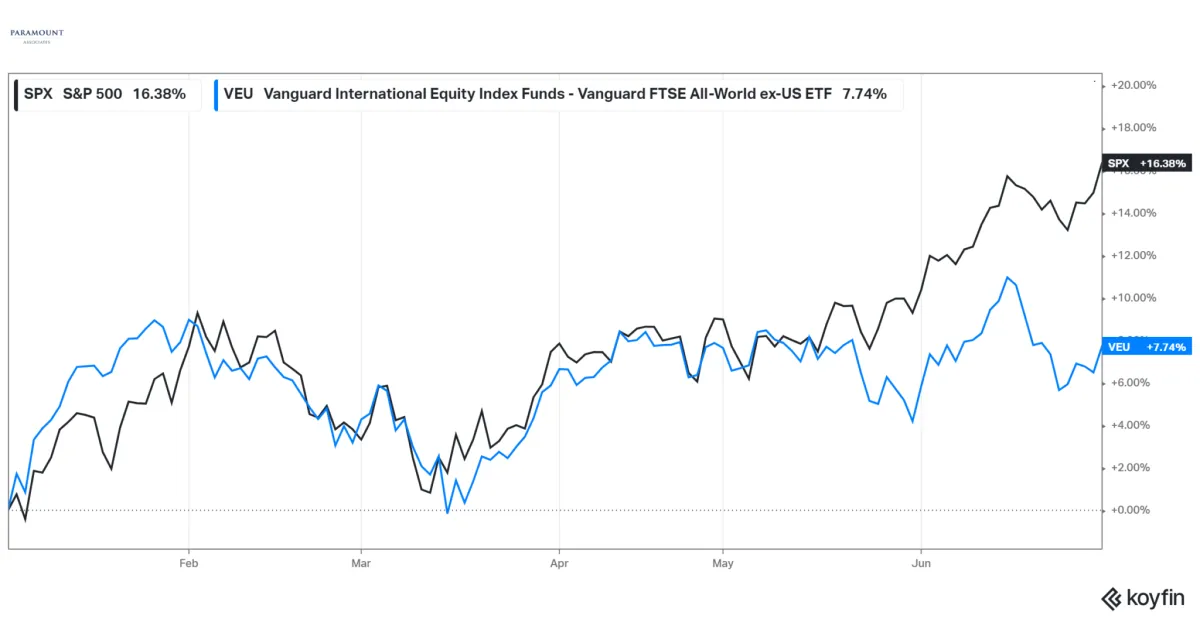
Year to Date Chart – S&P 500 (SPX) vs Vanguard All-World ex-US (VEU), Koyfin.com; accessed 7/19/2023
(2) OVERWEIGHT INDIA AND JAPAN, UNDERWEIGHT EUROPE
Emerging Market growth estimates are 1.19%9 for 2023 and 15.23%9 for 2024 and EM stock prices have lagged improving earnings estimates. India’s strong growth relative to the rest of the world is intriguing. Major economies were sent into shock as inflation jumped, however India’s inflation was already elevated at 7.59% in January 20202. India has shown resilence and an enate ability to withstand inflation. The Bank of India has a ‘tolerance band’ of 2% to 6% and inflation is currently within that range. More companies are setting up manufacturing in India and an estimated 68%2 of the population is of working age (15 to 64 years old); both are very positive for consumer spending and goods. Japanese stocks have rallied on corporate governance reform, an escape from ‘de’-flation, and a weaker yen. In fact, from April – June 2023 Japanese equities outperformed every global index including the Nasdaq. Japan, like India, appears to benefiting from strength in domestic demand. In Europe, inflation has proved hard to tame and interest rates are still rising – resulting in weak manufacturing indicators. Europe has worsened, with recession conditions approaching the European Central Bank has not shifted the path of rate hikes. This increases the odds of a policy mistake in Europe.
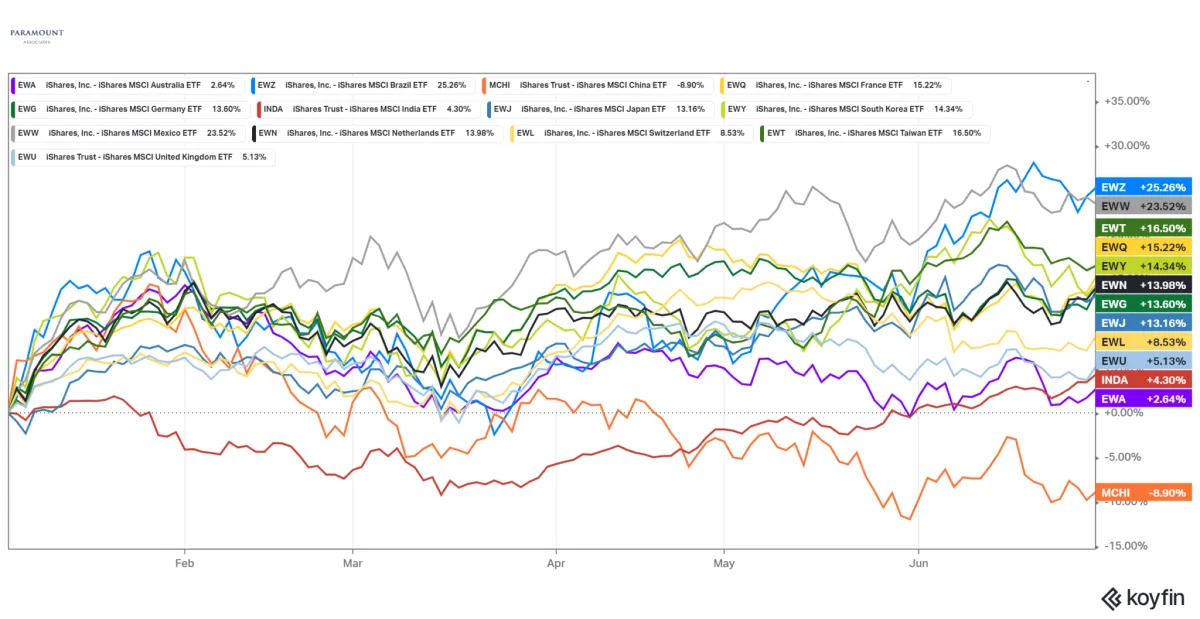
Year to Date Chart – Australia (EWA), Brazil (EWZ), China (MCHI), France (EWQ), Germany (EWG), India (INDA), Japan (EWJ), South Korea (EWY), Mexico (EWW), Netherlands (EWN), Switzerland (EWL), Taiwan (EWT), United Kingdom (EWU); Koyfin.com; accessed 7/19/2023
(3) INFLATION WILL DROP
Progress has been made as you will see in the chart below. Travel, leisure, and auto sales are all strong and continue to hold higher prices. Inflation has been dragged down by spending on basics by the lower to middle class. Restaurants and food sales are slowing with some of the savings excess removed from the economy. The last shoe to drop is always shelter, namely rents. Shelter is the biggest variable to inflation and there is evidence that rents have begun to turn.
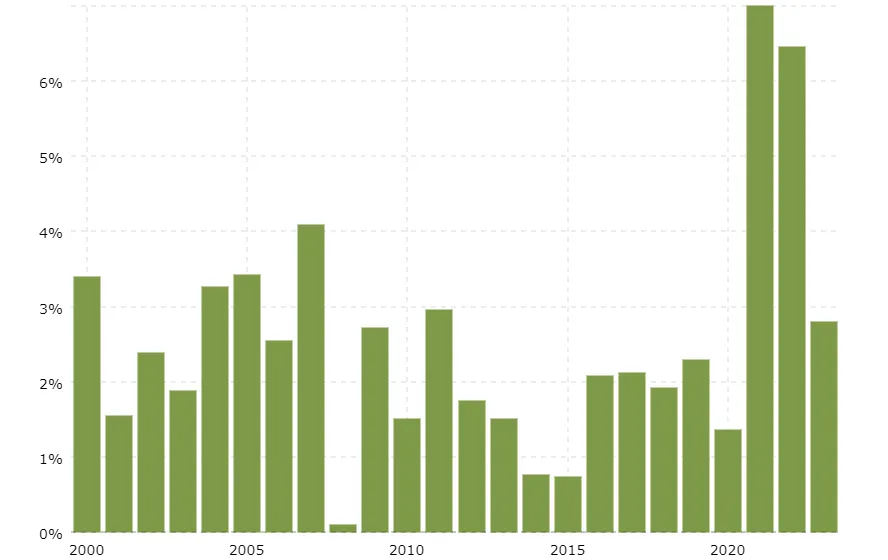
Historical Inflation Rate by Year; US Inflation rate – Since 2000, macrotrends.com, accessed 7/14/2023
(4) YIELDS HAVE PEAKED
Treasury yields tend to peak for the cycle months before the federal funds rate. The federal funds future market suggests the tightening cycle is essentially over. Interest rates began to drop after the banking sector instability. Rates have repriced higher on the back of a debt ceiling agreement and banking sector stability. I am becoming less negative on bonds, and I am growing negative on money markets. Yes, they pay over 5% now – however, it will be hard to annualize that percentage if rates begin to come down. When rates begin to come down investors will be better off in longer duration bonds as they receive income plus capital appreciation when prices of bonds raise.
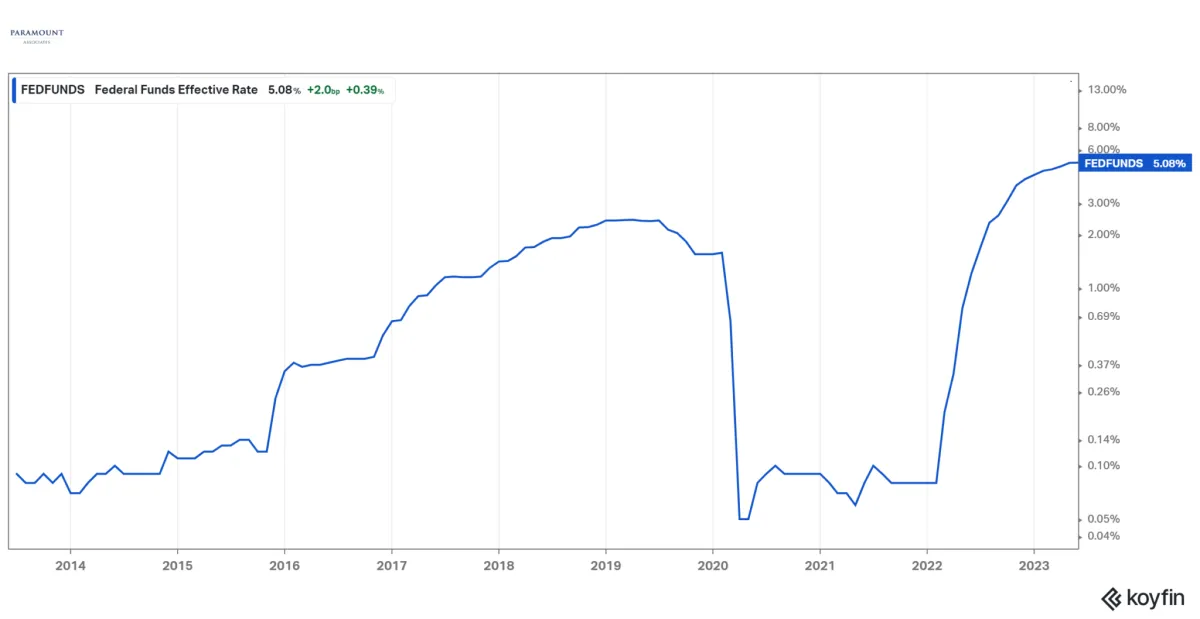
10 year chart – US Fed Funds Rate, Koyfin.com; accessed 7/19/2023
(5) SUSTAINABLE GROWTH WILL OUTPERFORM, HOWEVER EXPECTATIONS ARE INCREASING
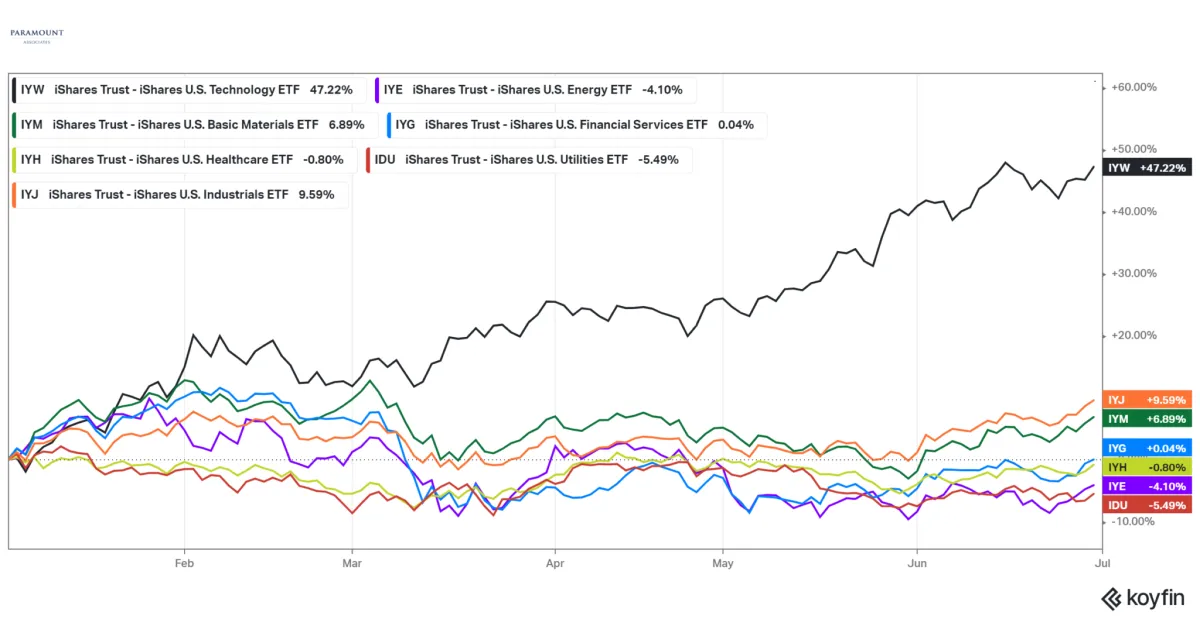
Excitement over AI (Artificial Intelligence) has driven equities this year. Recent enthusiasm over technology has overshadowed concerns of inflation, interest rates, and recession. The 10 largest stocks (Apple, Microsoft, NVIDIA, Amazon, Alphabet, Meta, Tesla, Broadcom, Salesforce, Advanced Micro Devices) have accounted for 79%5 of the S&P 500’s gains in the first half of the year. Why? Sustainable Earnings. These companies are structurally able to sustain growth even in periods of macroeconomic difficulty. With many investors fearing the Federal Reserve will slow the economy, these stocks have become the benefactors. In many ways, large growth stocks have become the new defensive equity positioning.
There is risk of ‘piling in’ and a rapid reversal. If you take out those top 10 stocks, the market’s Price/Earnings ratio is a reasonable 15.3X5 (cheaper than the long-term average P/E ratio of 16X6). There will be periods where lower valuation stocks can be found at very attractive valuations. In the short run, valuations are poor predictors of return. However, when looking at periods of one year or more they matter a lot.
I maintain our overweight to growth, however the likelihood of short-term outperformance lessens as earnings expectations and consumer sentiment increase.
Year to Date through 6/30/2023 – Invesco S&P 500 Low Volatility (SPLV), Ark Innovations (ARKK), Koyfin.com; accessed 1/21/2022
(6) CONSUMER CONFIDENCE AND MARKET RETURNS
Consumer sentiment rose to its highest level since September 2021 in July4. For those who know me, I see this as a sell signal.
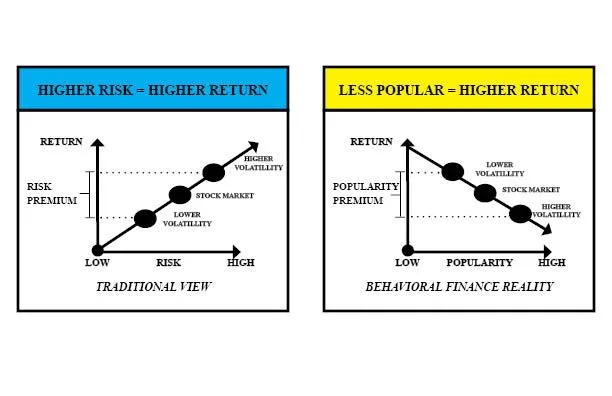
What US equity factor is the most predictive of future market returns? Most investors will answer ‘Fundamentals’ or ‘Momentum’ – however studies by Roger Ibbotson (Professor in Practice Emeritus, Yale School of Management) illustrate that the biggest contributor or detractor is actually Popularity. Traditionally market participants expect the greater the risk = greater return. Studies have shown that returns are not necessarily risk based. In reality the less popular the characteristics of a stock/asset class may be = the greater the return. From the period 1980 – 2016 the highest popularity stocks averaged 7.67%14 and the stocks with the least popular characteristics averaged 15.30%14.
Investor Education
HOW DO RISING INTEREST RATES AFFECT BONDS?
Bonds and interest rates have an inverse relationship. If interest rates rise, investors will prefer higher paying bonds. Investors then sell the lower paying bonds, driving down those bonds prices.
HOW DOES THE FEDERAL RESERVE AFFECT THE BOND MARKET?
The Federal Reserve controls the federal funds rate. The federal funds rate is the target rate at which commercial banks borrow and lend their excess reserves to each other overnight. This influences short-term rates on consumer loans, credit cards, and new bond issues. If new bond issues must keep up with the federal funds rate to create demand, lower paying bonds are sold pushing down those bond prices.
HOW DOES THE FEDERAL FUNDS RATE AFFECT INFLATION?
In general, when interest rates are high, the economy slows and inflation decreases. But why? If rates are high, consumers have less money to spend. Investors tend to save more because savings returns are higher. Additionally, loan demand decreases as borrowing costs increase.
SHOULD I ASSUME THAT THE 10-YEAR TREASURY WILL INCREASE ALONG WITH THE FEDERAL FUNDS RATE?
Normally the 10-year treasury yield is a precursor to expected increases in the federal funds rate. It will move ahead of the Federal Reserve and set market expectations. Historically rates have actually decreased after fed funds rate escalation. For two reasons: (1) Bond markets have a tendency to overprice actual Federal Reserve policy changes, (2) Investors expect economic growth to slow with higher rates and move to safer assets.
HOW DO RISING INTEREST RATES AFFECT STOCKS?
Generally speaking, rising interest rates are not welcomed by stock investors.
By raising interest rates, the Fed is increasing borrowing costs
Rising interest rates would encourage people to save more with higher savings yields
Credit card and other variable debt payments become more expensive slowing demand due to less consumer liquidity
Decreasing money supply in the system means a slower economy and less inflation
Dividends and Earnings are discounted to the new increased interest rates
Usually Federal Reserve interest rate hikes take 12 months for widespread economic impact