
Our approach continues to be ‘stay alive and look for the ball’. That sports analogy is a perfect way to explain investment management by Paramount Associates Wealth Management. We expect significant divergence in asset classes and within different sectors. Tactically, it’s certainly desirable to be in the market for potential gains, but it is equally important to thoughtfully manage portfolio risk.
Scott Tremlett, CIMA®, CFP®, ChFC® | CEO/Chief Investment Officer
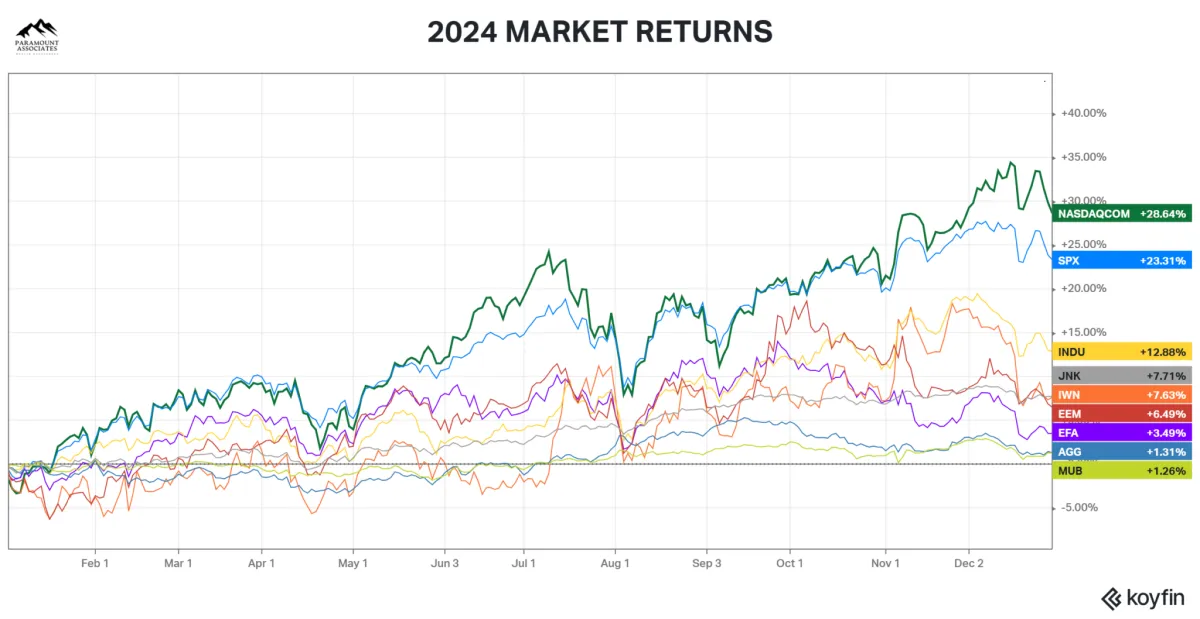
* NASDAQCOM = Nasdaq Composite Index, SPX = S&P 500 Index, INDU = Dow Jones Industrial Average, JNK = High Yield Bonds, IWN = Russell 2000 Value, EEM = MSCI Emerging Markets, EFA = MSCI Developed International, AGG = Aggregate Bond Index, MUB = National Municipal Bond
SUMMARY
We enter 2025 with a strong economy in the United States. Wages are up 4.1%2 (avg hourly earnings) and inflation is down to 2.6%3 (PCE) or 2.9%4 (CPI) depending on which measure you consider. One change in momentum in the United States (and globally) is a pick-up in Manufacturing and drop in Services growth. Overall, momentum is trending positively for the United States. Yes, there are unknowns – markets do not like unknowns. (1) Interest Rates: I do not think we will see a significant reduction in interest rates from current levels. (2) Tariffs: Worst case scenario is a one-time increase to inflation. Long-term effects will depend on how businesses and consumers respond to price changes. (3) Valuations: Will Earnings in the United States continue to maintain elevated valuations?
I believe these uncertainties, along with other potential unknowns, will make it challenging for the overall market to reach and sustain all-time highs. While animal spirits remain strong and the economy is robust, I have doubts about whether earnings can keep pace with current growth expectations. In this investment climate, I believe that ‘selective’ broadening within US markets, along with investments outside of traditional stock indices and bond markets, will be essential for achieving outperformance in 2025.
Please click on the tiles below to read more!


| US Equity: | Overweight |
| Developed Int’l Equity: | Overweight United Kingdom; Underweight Japan; Underweight Europe |
| Emerging Markets Equity: | Overweight India; Underweight China; Underweight Brazil |
| US Government Bond: | Underweight |
| US Corporate Bond: | Neutral |
| International Bond: | Underweight |
| Emerging Markets Bond: | Underweight |
| REIT/Commodity: | Underweight |
| Alternative Assets: | Overweight |
| Preferred Sectors: | Financial Services, Industrials, Technology |
SUMMARY

Equity Exposure: Top Holdings1
Autodesk, Inc
AerCap Holdings NV
Amazon.com, Inc
Apollo Global Management Inc
American Express Company
Berkshire Hathaway Inc
Crowdstrike Holdings, Inc
GE Aerospace
GE Verona Inc
Howmet Aerospace
Interactive Brokers Group, Inc
Eli Lilly and Company
MercadoLibre Inc
Meta Platforms Inc
Marvell Technology, Inc
Microsoft Corporation
NVIDIA Corp
PDD Holdings Inc, Sponsored ADR
Insulet Corporation
PayPal Holdings, Inc
Spotify Technology
StepStone Group, Inc
Talen Energy
Uber Technologies, Inc
Vertiv Holdings Co
Paramount Global Rankings
Paramount Global Rankings is a proprietary system that evaluates 20 countries worldwide. Every region and country is analyzed individually. Rankings are based on growth statistics, adjusted for monetary policy and valuations. The system considers two growth factors: Current (direct comparisons) and Momentum. The weighting of these factors varies depending on the prevailing economic conditions.
(as of December 2024)
#1. India
Current Power: 1 – #1 in every participating category
Momentum: 2 – Momentum dramatically improves for year-end
Overall Rank: 1
Monetary Policy: 6.25%
Valuation: Overvalued
Interest Rates: The RBI decided to lower the policy repo rate to 6.25% – the first move in 5 years. This decision reflects the central bank’s cautious approach amid concerns over inflation and uncertain growth prospects.
Inflation: Inflation remains a significant concern, with the Consumer Price Index (CPI) inflation projected to average 5.4% in 2024. The RBI aims to bring inflation closer to its medium-term target of 4%.
Economic Growth: The Indian economy continues to show resilience, with GDP growth projected at 6.3% for the fiscal year 2024-2025. This growth is supported by strong domestic demand and a robust services sector. Monetary Policy Stance: The RBI emphasized its commitment to maintaining price stability while supporting economic growth. The central bank also highlighted the importance of structural reforms to enhance economic resilience. *Reserve Bank of India statement 12/6/2024
#2. China
Current Power: 2 – Expansion in every category
Momentum: 11 – Momentum fades into year-end
Overall Rank: 2
Monetary Policy: 3.65%
Valuation: Undervalued
Interest Rates: The PBOC decided to keep the benchmark lending rate unchanged at 3.65%. This decision reflects the central bank’s cautious approach amid global economic uncertainties and domestic economic challenges.
Inflation: Inflation remains moderate, with the Consumer Price Index (CPI) rising by 1.8% year-on-year in December 2024. The PBOC aims to maintain price stability while supporting economic growth.
Economic Growth: The Chinese economy grew by 4.5% in 2024, driven by strong domestic consumption and investment. However, external demand has been weak due to global economic slowdowns.
Monetary Policy Stance: The PBOC emphasized its commitment to a prudent monetary policy, aiming to balance growth and risk prevention. The central bank also highlighted the importance of structural reforms to enhance economic resilience.
These measures reflect the PBOC’s efforts to navigate a complex economic environment while maintaining stability and supporting sustainable growth. *Reserve Bank of China (PBOC) statement 1/3/2025
#3. United States
Current Power: 6 – Led by Services and Retail Sales
Momentum: 6 – Strong Services and Retail Sales, Weak Manufacturing and Leading Indicators
Overall Rank: 3
Monetary Policy: 4.25 – 4.50%
Valuation: Overvalued
Interest Rates: The Federal Reserve decided to maintain the target range for the federal funds rate at 4.25% to 4.50%.
Economic Activity: Economic activity has continued to expand at a solid pace, with the unemployment rate stabilizing at a low level.
Inflation: Inflation remains somewhat elevated, but the Federal Reserve is committed to achieving its long-term goal of 2% inflation.
The Federal Reserve emphasized its commitment to supporting maximum employment and returning inflation to its 2% objective. They will continue to monitor economic indicators and adjust their policies as necessary to achieve these goals. *Federal Reserve statement 1/29/2025
#4. Spain
Current Power: 7 – Led by Manufacturing & Services
Momentum: 10 – #1 Services, Weak Retail Sales
Overall Rank: 4
Monetary Policy: 2.90%
Valuation: Undervalued
Interest Rates: The main refinancing operations rate is set at 2.90%, the deposit facility rate at 2.75%, and the marginal lending facility rate at 3.15%.
Inflation: The inflation rate in the euro area was 2.4% in December 2024, slightly above the European Central Bank’s target of 2%.
Economic Outlook: The Banco de España continues to support the European Central Bank’s measures to maintain price stability and ensure economic growth within the euro area.
These measures are part of the broader strategy to stabilize the economy and manage inflation effectively. *Banco de Espana statement 1/30/2025
#5. Brazil
Current Power: 4 – #4 Broad strength across categories
Momentum: 17 – #1 GDP Growth, Weakness across other categories
Overall Rank: 5
Monetary Policy: 13.25%
Valuation: Undervalued
Interest Rates: The Central Bank raised the benchmark Selic rate by 1 percentage point to 13.25% per year. This marks the fourth consecutive rate hike, driven by concerns over rising inflation and economic uncertainties.
Inflation: Inflation remains a significant concern, with both headline and core inflation exceeding the target. The inflation rate for 2024 was 4.83%, surpassing the target ceiling. The Central Bank aims to bring inflation back to the target range of 3%, with a tolerance of 1.5 percentage points up or down.
Economic Activity: The Brazilian economy showed resilience, growing by 0.9% in the third quarter of 2024.
However, the Central Bank noted that the economy is heating up, with strong domestic demand and a robust labor market and further interest rate hikes might be necessary. *Central Bank of Brazil statement 1/29/2025
#6. Canada
Current Power: 12 – Strong Manufacturing
Momentum: 8 – Weak Services, Retail Sales mixed
Overall Rank: 6
Monetary Policy: 3.00%
Valuation: Undervalued
Interest Rates: The Bank of Canada lowered the policy interest rate by 25 basis points to 3%. This marks the sixth consecutive rate cut.
Inflation: Inflation has been close to the 2% target since last summer. The Bank expects inflation to remain near this target over the next two years, despite some volatility due to temporary tax measures.
Economic Growth: Economic activity is gaining momentum, supported by lower borrowing costs. Household spending, particularly in the housing market and on big-ticket items, is picking up. The Bank forecasts GDP growth to strengthen from 1.3% in 2024 to 1.8% in 2025 and 2026.
*Trade Uncertainty*: A major uncertainty is the potential for a trade conflict triggered by new US tariffs on Canadian exports. This could be very disruptive to the Canadian economy and is clouding the economic outlook.
The Bank of Canada remains committed to maintaining price stability and supporting economic growth amid these challenges. *Bank of Canada statement 1/29/2025
#7. Italy
Current Power: 19 – Weakness across all categories
Momentum: 1 – Top 5 in all categories but one
Overall Rank: 7
Monetary Policy: 2.75% (depo rate)
Valuation: Undervalued
Interest Rates: The European Central Bank (ECB), which sets monetary policy for the Eurozone including Italy, decided to lower the deposit facility rate by 25 basis points to 2.75%. This decision aims to moderate the degree of monetary policy restriction.
Inflation: Inflation in the Eurozone is projected to average 2.5% in 2024, 2.2% in 2025, and 1.9% in 2026. Core inflation, which excludes energy and food prices, is expected to decline from 2.9% in 2024 to 2.0% in 2026.
Economic Growth: Momentum has increased from depressed levels. Lawmakers are under pressure to reduce Italy’s deficit.
Monetary Policy Stance: The ECB emphasized its commitment to ensuring that inflation returns to its 2% medium-term target. The policy rates will remain sufficiently restrictive for as long as necessary to achieve this aim. *European Central Bank statement 1/30/2025
#8. France
Current Power: 16 – Weakness in all categories other than Leading Indicators
Momentum: 4 – Strength in Services and Leading Indicators
Overall Rank: 8
Monetary Policy: 2.75% (depo rate)
Valuation: Undervalued
Interest Rates: The European Central Bank (ECB), which sets monetary policy for the Eurozone including France, decided to lower the deposit facility rate by 25 basis points to 2.75%. This decision aims to moderate the degree of monetary policy restriction.
Inflation: Inflation in the Eurozone is projected to average 2.5% in 2024, 2.2% in 2025, and 1.9% in 2026. Core inflation, which excludes energy and food prices, is expected to decline from 2.9% in 2024 to 2.0% in 2026.
Economic Growth: France’s economy was given a boost by the Olympic Games, but budget deficits and growing debts are headwinds to sustained growth.
Monetary Policy Stance: The ECB emphasized its commitment to ensuring that inflation returns to its 2% medium-term target. The policy rates will remain sufficiently restrictive for as long as necessary to achieve this aim. *European Central Bank statement 1/30/2025